When managing logistics and deliveries, keeping track of delivery time accuracy is crucial for customer satisfaction. This is especially important in industries like e-commerce, food delivery, or logistics, where customers expect timely service. In this blog post, we’ll dive into a practical SQL interview question that asks us to identify delayed orders and calculate the average order value (AOV) for each delivery partner. We’ll walk through a detailed solution, using a sample dataset, and explain each step in detail.
Problem Statement
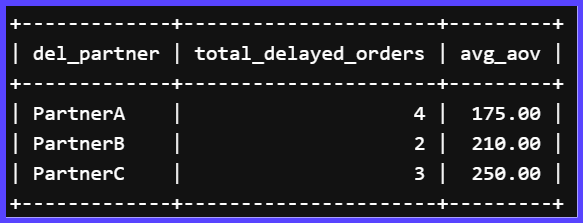
Write a SQL query to calculate the number of delayed orders and the average order value (AOV) for each delivery partner. An order is considered delayed if the actual delivery time exceeds the predicted delivery time. Display the delivery partner, the total number of delayed orders, and the average AOV for delayed orders.
Understanding the Dataset
We have a table named orders with the following structure:
| orderid | custid | city | date | del_ partner | order_ time | deliver_ time | predicted_ time | aov |
|---|---|---|---|---|---|---|---|---|
| 1 | 101 | Bangalore | 01-01-24 | PartnerA | 10:00:00 | 11:30:00 | 60 | 100 |
| 2 | 102 | Chennai | 02-01-24 | PartnerB | 12:00:00 | 13:15:00 | 45 | 200 |
| 3 | 103 | Bangalore | 03-01-24 | PartnerA | 14:00:00 | 15:45:00 | 60 | 300 |
| 4 | 104 | Chennai | 04-01-24 | PartnerB | 16:00:00 | 17:30:00 | 90 | 400 |
| 5 | 105 | Delhi | 05-01-24 | PartnerC | 9:00:00 | 10:30:00 | 60 | 150 |
| 6 | 106 | Delhi | 06-01-24 | PartnerC | 11:00:00 | 13:00:00 | 90 | 250 |
| 7 | 107 | Bangalore | 07-01-24 | PartnerA | 8:30:00 | 9:45:00 | 60 | 120 |
| 8 | 108 | Chennai | 08-01-24 | PartnerB | 13:00:00 | 14:30:00 | 60 | 220 |
| 9 | 109 | Delhi | 09-01-24 | PartnerC | 15:00:00 | 17:15:00 | 120 | 350 |
| 10 | 110 | Bangalore | 10-01-24 | PartnerA | 18:00:00 | 19:45:00 | 90 | 180 |
Analyzing the Problem
- Identify Delayed Orders: A delayed order is one where the actual delivery time exceeds the predicted delivery time. To determine this, we need to calculate the difference between
order_timeanddeliver_timeand compare it withpredicted_time. - Calculate the Average AOV: For each delivery partner, compute the average order value of delayed orders.
- Display Required Data: The output should include the delivery partner, the total number of delayed orders, and the average AOV for delayed orders.
Solution Explanation
Let’s break down the SQL query step by step:
- Calculate the Actual Delivery Time: Use the
TIMESTAMPDIFFfunction to find the difference betweenorder_timeanddeliver_timein minutes. - Filter Delayed Orders: Use a
WHEREclause to filter rows where the actual delivery time exceedspredicted_time. - Group and Aggregate: Use
GROUP BYto group the results bydel_partnerand calculate the total number of delayed orders and the average AOV for each delivery partner.
MySQL Query to Create Table and Insert Data
-- Create the orders table
CREATE TABLE orders (
    orderid INT PRIMARY KEY,
    custid INT,
    city VARCHAR(50),
    date DATE,
    del_partner VARCHAR(50),
    order_time TIME,
    deliver_time TIME,
    predicted_time INT, -- This stores the predicted delivery time in minutes
    aov DECIMAL(10, 2)  -- This stores the average order value
);

-- Insert data into the orders table
INSERT INTO orders (orderid, custid, city, date, del_partner, order_time, deliver_time, predicted_time, aov) VALUES
(1, 101, 'Bangalore', '2024-01-01', 'PartnerA', '10:00:00', '11:30:00', 60, 100),
(2, 102, 'Chennai', '2024-01-02', 'PartnerB', '12:00:00', '13:15:00', 45, 200),
(3, 103, 'Bangalore', '2024-01-03', 'PartnerA', '14:00:00', '15:45:00', 60, 300),
(4, 104, 'Chennai', '2024-01-04', 'PartnerB', '16:00:00', '17:30:00', 90, 400),
(5, 105, 'Delhi', '2024-01-05', 'PartnerC', '09:00:00', '10:30:00', 60, 150),
(6, 106, 'Delhi', '2024-01-06', 'PartnerC', '11:00:00', '13:00:00', 90, 250),
(7, 107, 'Bangalore', '2024-01-07', 'PartnerA', '08:30:00', '09:45:00', 60, 120),
(8, 108, 'Chennai', '2024-01-08', 'PartnerB', '13:00:00', '14:30:00', 60, 220),
(9, 109, 'Delhi', '2024-01-09', 'PartnerC', '15:00:00', '17:15:00', 120, 350),
(10, 110, 'Bangalore', '2024-01-10', 'PartnerA', '18:00:00', '19:45:00', 90, 180);
Here is the SQL query that solves the problem:
SELECT
    del_partner,
    COUNT(*) AS total_delayed_orders,
    ROUND(AVG(aov), 2) AS avg_aov
FROM
    orders
WHERE
    TIMESTAMPDIFF(MINUTE, CONCAT(date, ' ', order_time), CONCAT(date, ' ', deliver_time)) > predicted_time
GROUP BY
    del_partner;
Explanation of the Query
TIMESTAMPDIFFFunction:TIMESTAMPDIFF(MINUTE, CONCAT(date, ' ', order_time), CONCAT(date, ' ', deliver_time))calculates the difference in minutes between theorder_timeanddeliver_time.WHEREClause:
Filters rows where the actual delivery time (in minutes) is greater than thepredicted_time, indicating a delayed order.COUNT(*)Function:
Counts the number of delayed orders for each delivery partner.AVG(aov)Function:
Computes the average AOV for delayed orders for each delivery partner. TheROUNDfunction rounds the result to 2 decimal places.GROUP BYClause:
Groups the result bydel_partnerto get the total delayed orders and average AOV for each partner.
Result of the Query

Practice Questions
To further improve your SQL skills, try solving the following questions:
- Write a query to find the total number of orders for each delivery partner.
- Calculate the percentage of delayed orders for each partner.
- Find the delivery partner with the highest average AOV for all orders.
- Write a query to list all orders that were delivered on time.
- Determine the delivery partner with the most delayed orders in a given city.
Conclusion
This blog post provided a detailed solution to calculating delayed orders and average AOV by delivery partner using MySQL. Understanding such queries can be beneficial for anyone preparing for SQL interviews or working in data analysis roles within logistics and delivery-driven industries. By breaking down the problem, we gained a deeper understanding of how to manipulate and analyze time-based data using SQL.

